Climate change and statistics are a much-debated issue. That is because, more in general, statistics tend to predict the future. In the case of climate change, our future looks rather bleak.
To produce climate change statistics is a highly professional job, requiring meticulously applied scientific, mathematical methods. Only very few professionals know the ins and outs of these methods.
This is probably why the United Nations (UN) generated its climate statistics from 130 countries across the globe. The UN also debated the indicators for their climate change statistics with these countries. This bottom-up approach must provide the much-needed trust.
Some of the links are affiliate links. As an affiliate associate, we earn a commission when you purchase any of the products offered through the shared links at no extra cost for you. This helps us maintain this website.
Table of contents
Climate Change and Statistics are Inextricably Connected
Fear of statistics is totally uncalled for because they help us to get more grip on our future and what we can do to fight, for example, climate change. Moreover, statistics can be very entertaining.
Statistics can also get us off guard
But how can we, as laymen, understand climate change and statistics? Before you think this article is about statistics. It’s not. I just want to throw some light on how statistics became an intricate part of our everyday life.
Perhaps this will enable us to better understand statistics, whether these statistics refer to climate change or another actual topic such as COVID-19.
This is of some relevance because, in these turbulent times, the media throw one statistic after the other at us. Every statistic is countered by a ‘culture of scepticism’. This scepticism is understandable, but not very productive.
It’s not easy to produce reliable statistics and often not very easy to understand their significance. More specifically so when statistics try to grapple with everyday changes.
The First Measured Century

One of the most interesting books I ever bought is The First Measured Century. An Illustrated Guide to Trends in America, 1900-2000. The title sounds a bit boring, but the content is amazing. Let me give some examples.
At the beginning of the 20th century, 76 million people lived in the USA, at the end 276 million. In 1900 life expectancy in the USA was on average 50 years, in 2000 it’s almost 80 years. From 1900 to the year 2000, the number of young people in the ages 0-19 went down a third.
Ages 60 and over of the total population tripled from 1900 to 2000. Moreover, the number of centenarians quintupled from 1900 to 2000. The shift to an ageing society started earlier than I assumed.
But the rise of centenarians did not start before the Seventies. This rise is not only demographic but can also be attributed to technological progress in healthcare and better living conditions.
Occupational changes
The most striking of the US statistics are the occupational changes. The percentage of employed male farmers, fishermen, forestry workers, miners (blue-collar workers), and the like decreased tenfold from 1900 to 2000. Whereas in the same period the so-called tertiary (white-collar) occupations more than doubled.
However, for an understanding of modern society, it’s important to take a closer look at the rise of some white-collar occupations. Per thousand inhabitants the number of physicians almost doubled, and the number of lawyers more than doubled.
But the number of engineers rose by an astounding fifteenfold. I bet you thought there were more lawyers! Well, at least I did.
Social emancipation

The impact of social changes is best understood from two developments. The first is the decrease of people over 65 in the labour force from two-thirds in 1900 to one-fifth in 2000. This change was only possible with immense investments in pension plans.
The second example is the rise of women in the labour force. With a short hiccup during the Second World War, the number of married women, of the total of married women in the labour force, steadily rose tenfold from 1900 to 2000.
Of course, it’s an interesting question what drove the rise of married women in the labour force. Was it a shift in public opinion towards emancipation? Or was it an economic necessity, boosted by consumer demand?
Economic emancipation

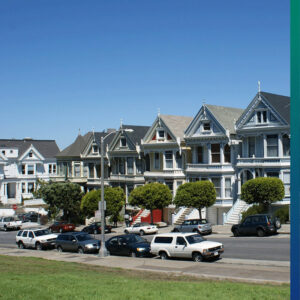
Probably both developments coincided. The economic necessity can be explained by the overall rise of the population living in suburbs. In 2000 half of the population lived in suburbs, whereas in 1900 this was just a little bit over a tenth.
Living in suburbs usually comes with a house of one’s own and more cars. These could only be afforded with a mortgage and more income.
Public opinion polls substantiate the emancipation shift. In 1936 an estimated 82% of the population disapproved of married women working. In 2000 this percentage was down to less than a fifth.
These numbers also show that there will always be people shying away from modern society. However, let’s not forget the most powerful driving force of these two changes: education!
In 1910, for the first time, educational results were measured on a national level in the USA. In that year, only 3% of the population of 25 and older was a college graduate or higher. In the same age group, just over 10% were high school graduates or higher. At the end of the century in both cases, the numbers had risen eightfold. An astounding achievement.
The statistical universe

We live in a statistical universe. At the end of the 19th and the beginning of the 20th century, scientists could gratify their occupational rigour by referring to a few cases or even one. In contrast, modern scientific rigour dictates highly complicated statistical, meaning mathematical, rules and the use of very large samples.
Such rules and samples enable reliable and viable cross-references. Reliability and viability require rigorous scientific methods. However, this essential methodical knowledge is more and more limited to a very small circuit of experts. Moreover, computers exert a decisive role in modern statistical science.
The First Measured Century, the guide to US-trends from the year 1900 to 2000, illustrates that statistics give us valuable knowledge. But the book also shows that statistics can be very entertaining.
Every advantage has its disadvantage

However, no matter how insightful statistics may be, the downside of statistics is that individual, everyday experiences disappear. At the end of the 20th century, a scientist even complained that the individual had totally disappeared from the science of psychology!
We can experience this also from the statistics of the current pandemic. No matter how many people were discharged from the hospitals, how many are still affected, and how many died, we hardly can get a grip on the individual human suffering.
Nor can we understand human suffering in war or in the numerous refugee camps around the world. Refugees who partly fled for forest fires and floods caused by climate change.
It is also very difficult for us to understand how we individually will be affected by climate change. Statistics obstruct our experience of individual consequences. The more we will have to fight collectively to uncover these individual consequences.
Do you trust statistics, and if so or not so, why? Please let us know in the comment box below.
Everything can be used or abused. Statistics in reliable hands can not be ignored. If we realised that pollution was a less big problem. We start to doubt statistics when the predictions touched our devastating lifestyle. We must doubt ourselves, not statistics!
Hi Jos,
Thank you for your comment. I totally agree with you, we must doubt ourselves, not statistics.
Nevertheless, statistical experts, such as Drenth, Sijtsma, and Bronner, opened my eyes by explaining that what comes out of statistics, is usually what we have put in them.
This is a comforting thought because it endorses your statement that we must doubt ourselves. At the moment, there is a beautiful series about mathematics on ARTE-tv. This also helped my understanding of the relative value of statistics.
Then there is the issue that we must doubt ourselves. Every day we all make decisions without doubting a second their rectitude. This is of course where all those ‘wicked problems’ originate.
Although I totally agree with you, I doubt whether we can always doubt ourselves. When we would, our lives would probably be very upsetting. And they are already very upsetting as it is.
Stay safe, stay healthy.
Regards,
Tom